College Football Matchup Simulator
For this Computing II project we built a Java and Vaadin application that compares college football teams from different seasons. The main challenge was making teams from different years comparable, because raw football statistics change over time as the sport changes. Our approach was to build team season profiles, normalize each team against the rest of its own season, and then use those profiles to estimate matchup results.
- System built: interactive college football matchup predictor
- Main tools: Java, Vaadin, OpenCSV, SMILE, GitHub
- Data used: college football box score data from 2002 through 2025
- Main output: projected score, win probability, matchup category leans, and home field scenarios
- IE connection: decision support, performance comparison, data normalization, and simulation
Project Summary and Skills Used

Question. How can two college football teams from different seasons be compared in a fair way
Why this question is interesting. A team with strong raw stats in one year may not mean the same thing as a team with similar raw stats in another year. Offensive pace, defensive style, schedule strength, and the general direction of college football all change over time. To make a useful simulator, the program needs to compare each team to the teams from its own season before comparing it to a team from another season.
What the project does.
The program reads college football box score data, builds one profile for each team and season, and stores the important offensive and defensive averages. Those profiles are then normalized so each team is described by how strong it was relative to the rest of the league that year. This lets the simulator compare teams across years without treating raw yards or points as if every season had the same context.
Data and purpose.
The project uses college football box score data from the 2002 through 2025 seasons. The intended purpose is to let a user select two FBS team seasons and get a readable matchup preview with a projected winner, expected score, win probability, matchup category comparisons, and home field scenarios.
Industrial Engineering context.
The project connects to Industrial Engineering because it is a small decision-support system. It takes messy performance data, standardizes it, compares alternatives, and turns the results into information a user can act on. That is similar to how IE work often uses data, modeling, and interfaces to support better decisions.
Important skills practiced.
- Built custom Java classes to represent team season profiles, normalized statistics, and matchup results.
- Used ArrayLists and file input to load and organize the football data.
- Used Vaadin to build the interactive web interface.
- Used OpenCSV for reading CSV data and SMILE for the sigmoid win probability calculation.
- Used GitHub workflows with teammates while moving from the first project repo into the Vaadin repo.
My specific contribution.
My work focused heavily on the normalization and simulation logic. I helped move the project toward team season profiles, added the matchup comparison structure, worked through the home field scenario logic, and helped shape the Vaadin output so the results were easier to read.
Project Development Process
Original goal.
The original idea was to simulate college football matchups across different seasons. At first, the focus was mostly on getting team statistics into the program and comparing the numbers directly.
How the design changed.
The biggest design change was moving away from game-by-game normalization. Instead of treating every game row as a separate team identity, the project now builds one team season profile for each team and season. This made the model easier to explain and made the simulation more logical.
Roadblocks and solutions.
One roadblock was figuring out how to compare teams from different eras. Raw yards, points, and passing numbers are not always fair across seasons. The solution was to normalize each team relative to its own season before comparing it with another team. Another roadblock was making the output understandable, so the Vaadin page was adjusted to show result cards, matchup tables, and home field charts instead of only raw numbers.
Final direction.
The final project kept the same general idea, but it became more structured than the original version. It changed from a basic stat comparison into a cleaner matchup tool with normalized team profiles, neutral results, home field scenarios, and an upset watch feature.
How a User Interacts With the Tool
- The user picks a year and team for Team A.
- The user picks a year and team for Team B.
- The user runs the matchup or uses the random matchup button.
- The application shows the neutral field result first.
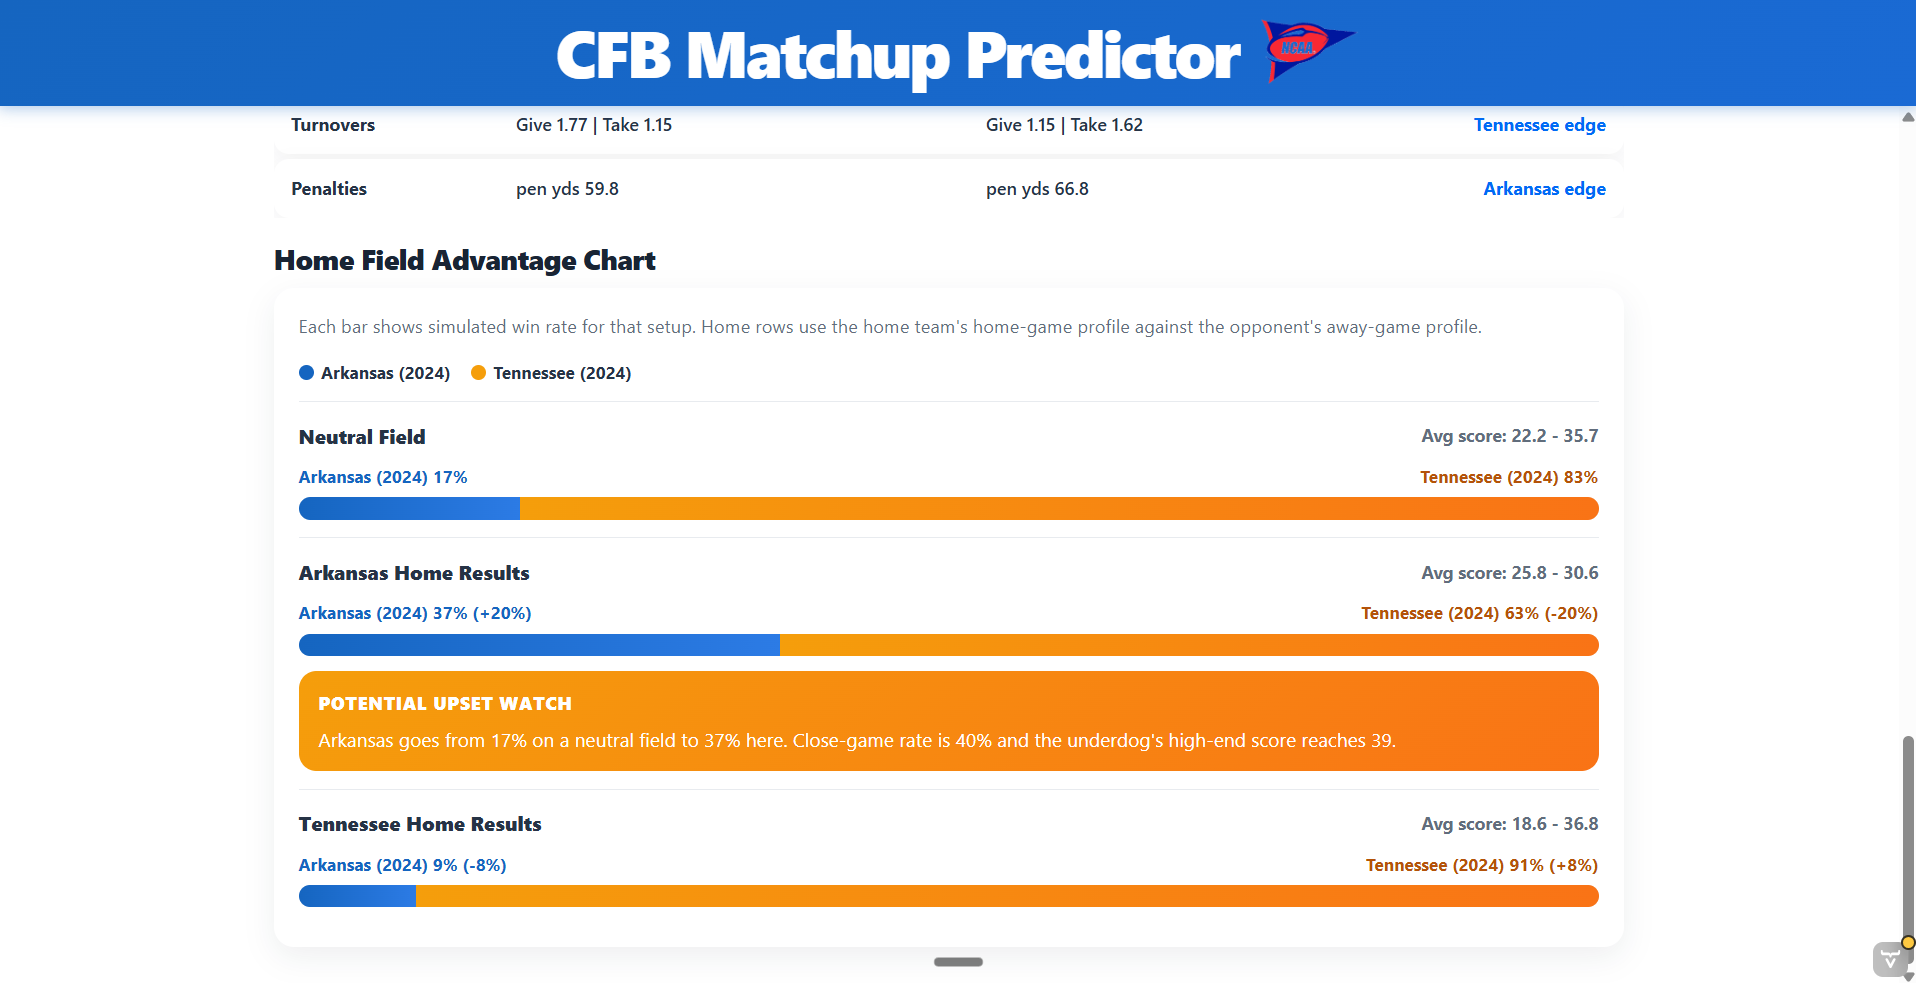
- The application then compares home field scenarios and flags possible upset situations.
Normalization and Team Profiles
Question. What information should represent one team for one season
Why this question is interesting. Early versions of the project focused too much on individual game rows. That made the data harder to use because a team could appear many times and each game could have a different level of randomness. A better structure is one team season profile, because the simulation is trying to compare complete teams instead of isolated games.
What the code does.
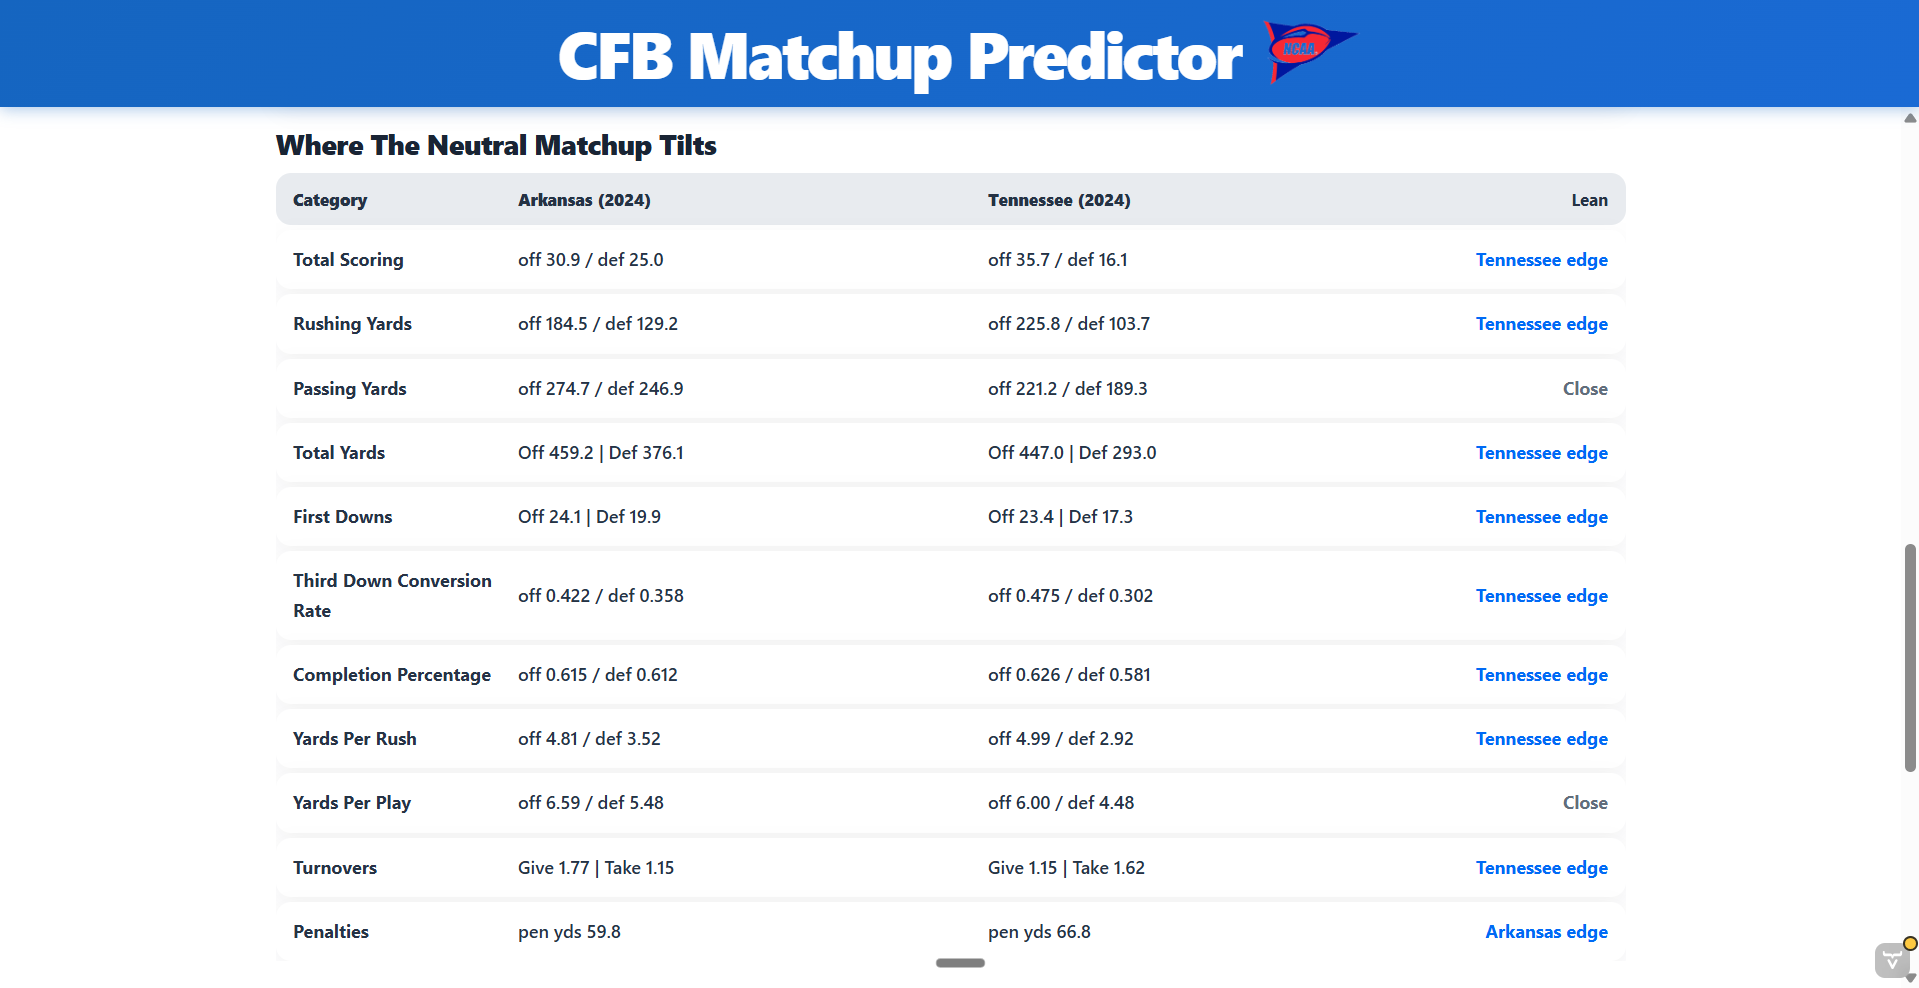
The Java code groups the data by team and season, calculates season averages, and then creates normalized values for the main football categories. The current profiles include scoring, rushing, passing, total yards, first downs, third down performance, passing accuracy, yards per rush, yards per play, turnovers, and penalty discipline. This gives the matchup model a cleaner summary of each team before any prediction is made.
Key Features and Highlights
Matchup Simulation
Question. How should the model decide which team has the advantage
Why this question is interesting. A matchup should not be decided by flipping a coin for each stat category. Football matchups make more sense when one team’s offense is compared against the other team’s defense. For example, a rushing offense should be judged against the opponent’s rushing defense, not just against the other team’s rushing offense.
What the simulation shows.
The model compares each team’s offensive strengths against the other team’s defensive resistance. It creates an expected score for both teams, estimates win probability with a SMILE sigmoid calculation, and shows which matchup areas lean toward each team. The interface also compares neutral results with home field scenarios so the user can see whether location creates a possible upset opportunity.
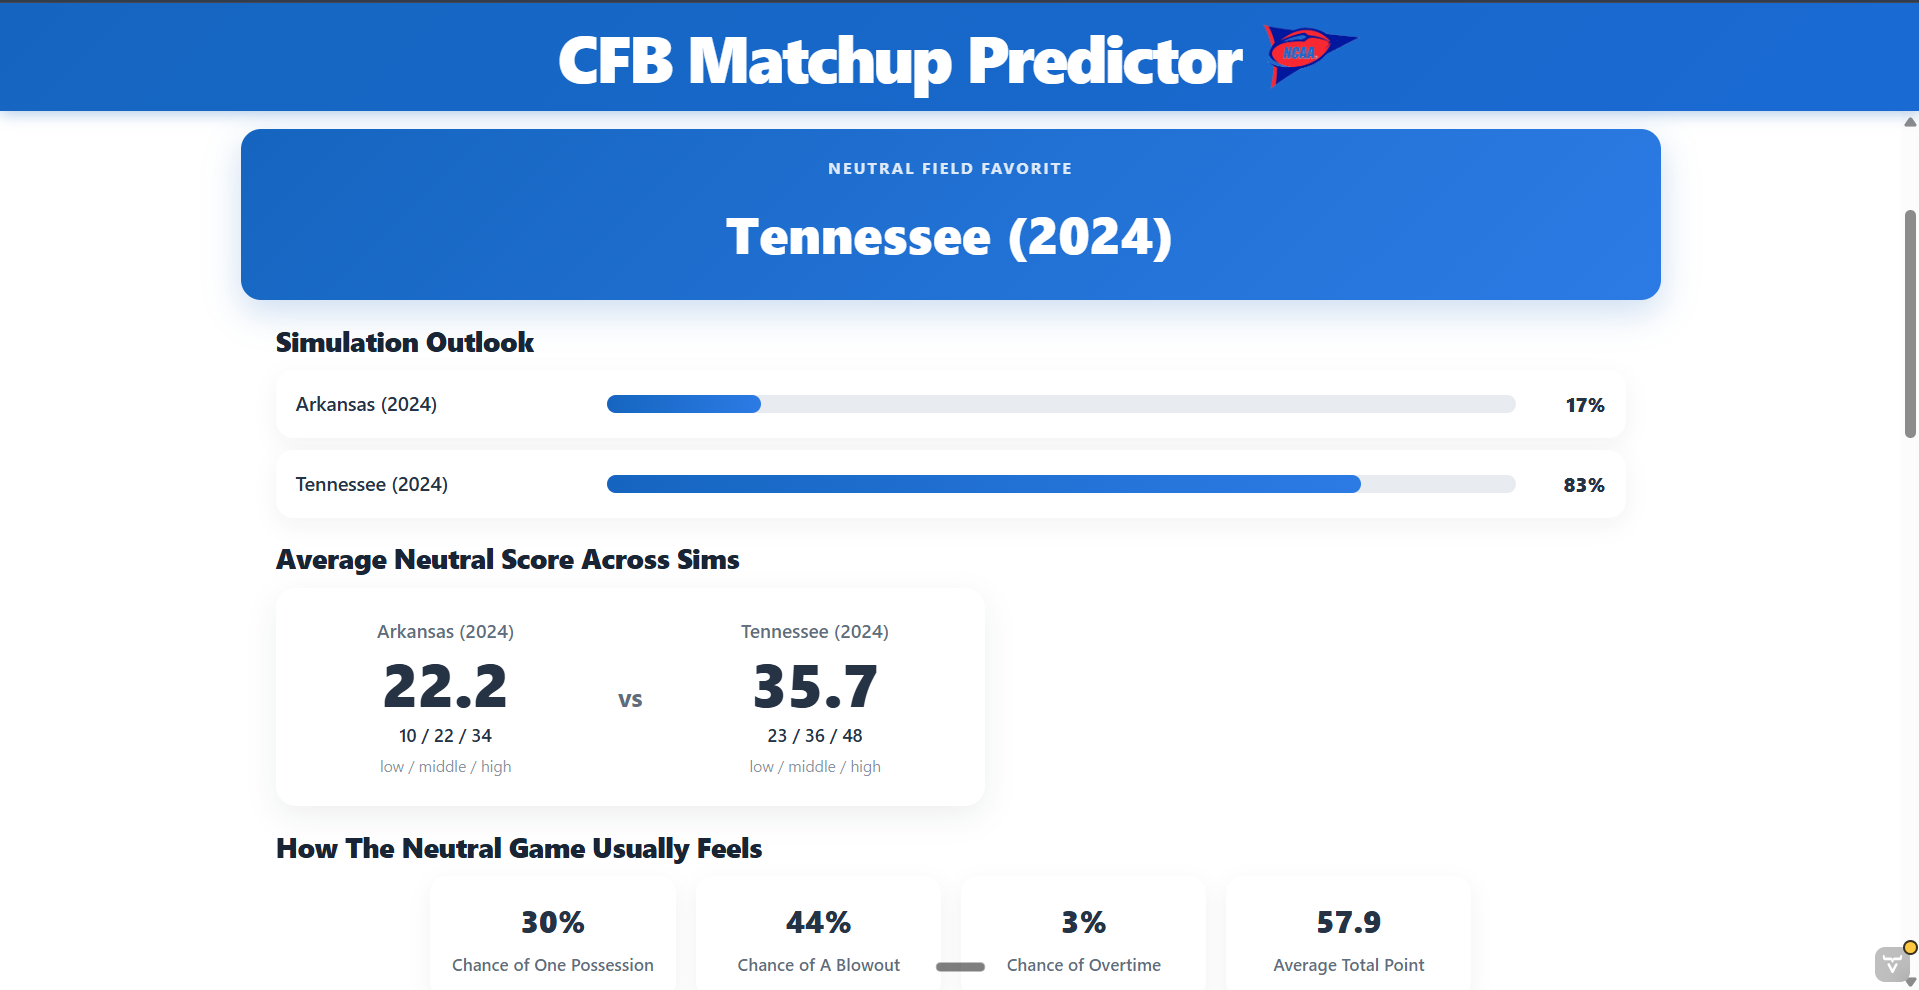
One small but important model detail is the probability step. The expected score difference is converted into a win probability using SMILE:
return MathEx.sigmoid((expectedScoreTeamA - expectedScoreTeamB) / 6.5);This matters because it turns a score difference into a percentage that is easier for users to understand.
Vaadin Interface
Question. How can the results be shown in a way that is easy to understand
Why this question is interesting. The model produces several numbers, but the user should not have to read raw code or raw data to understand the result. The interface needs to turn the model output into a clear football-style summary.
What the interface shows.
The Vaadin page lets the user select two team seasons or choose a random matchup. After running the simulation, the page displays the projected winner, expected score, win probability, matchup categories, and a home field advantage chart. The goal is to make the output feel like a simple game preview rather than a spreadsheet of calculations.
Limitations and Future Improvements
The model is useful as a proof of concept, but it is still a simplified version of football. The current version focuses on team-level season statistics, so it does not fully account for injuries, weather, coaching changes, strength of schedule, or player-level matchups. A future version could add more advanced strength-of-schedule adjustments, allow users to filter by conference or era, and improve the model with historical validation against real game outcomes.
Reflection
This project connected data cleaning, object-oriented Java, model design, and user interface work. The most important lesson was that the structure of the data matters as much as the prediction formula. Once the project moved from game rows to team season profiles, the logic became easier to explain and the simulation became more meaningful.
My main contribution was helping shape the normalization and simulation logic so the model compared teams in a way that made football sense. I am proud of the move from raw stat comparisons to team season profiles because that made the project more fair, more organized, and easier to explain. I also grew more confident working through a larger Java project where the data model, prediction logic, and user interface all had to fit together.